
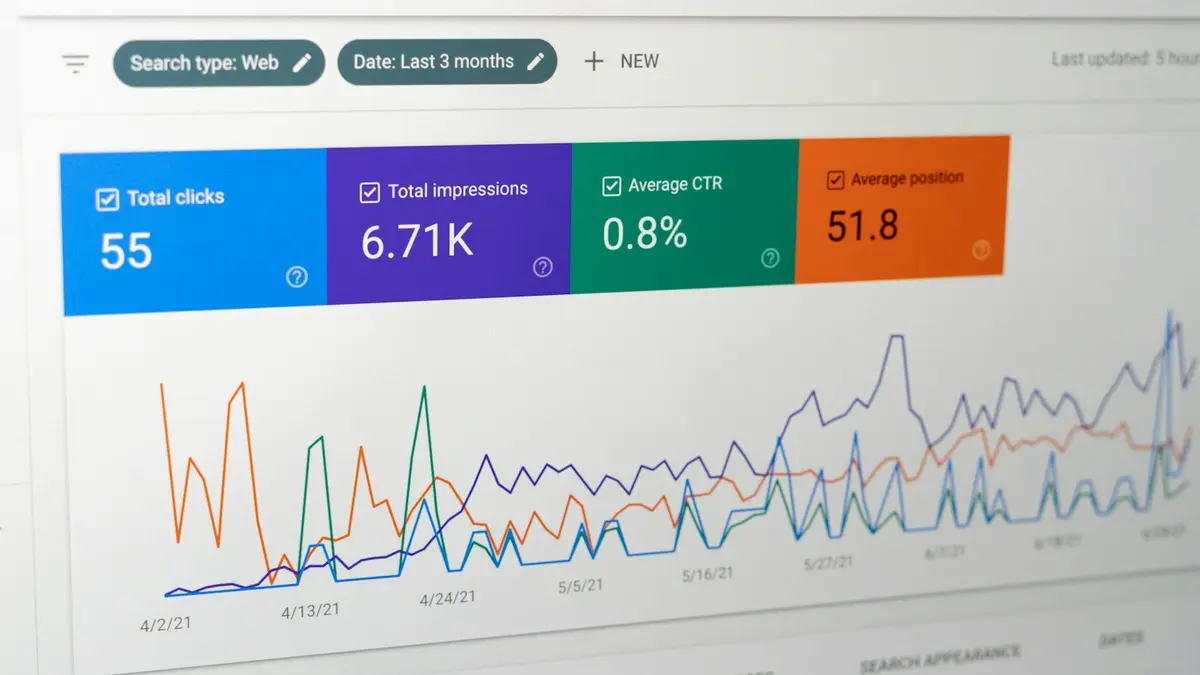
The reason observability gets its own article rather than a paragraph in an architecture document is a specific and common failure: every infrastructure metric is green and the site is unusable.
That is not an edge case. A Drupal site with a saturated database connection pool, an unwarmed cache after a deployment, a failing search backend or a full queue will present as healthy servers serving broken pages. Infrastructure monitoring cannot see it, because nothing about the infrastructure is wrong.
Three layers, and only one is usually instrumented
Infrastructure. CPU, memory, disk, network, instance health. Necessary, easy, and the layer that arrives free with the cloud account. It answers "is the machine alive".
Platform services. Database connections and slow queries, cache hit ratio and evictions, load balancer error rates and latency distribution, storage throughput, queue depth. This is where most real degradation is first visible.
Application. Drupal's own behavior: PHP errors and fatals, response time by route rather than in aggregate, cron and queue processing, search indexing lag, the watchdog log, and whether the site can actually reach its dependencies.
Most estates instrument the first thoroughly, the second partially and the third not at all, which is precisely inverted relative to where incidents originate.
What to measure at the Drupal layer
- Response time by route. An average across a site is dominated by cached anonymous pages and hides an authenticated route that has become slow. Percentiles, per route.
- Cache hit ratio. A sudden drop is the most reliable early warning available, and usually indicates a deployment that invalidated more than intended.
- PHP errors and fatals. Counted, with a rate rather than a total, so a step change is visible.
- Cron and queue. Whether cron ran, how long it took, and whether the queue is draining. A queue that grows steadily is a slow incident.
- Search index lag. Content published and not findable is a defect editors report and monitoring rarely catches.
- Database behavior from the application's point of view. Slow queries attributed to routes, not merely counted.
- Authenticated traffic separately. Anonymous traffic is largely answered at the edge. Authenticated traffic is what actually exercises the platform.
The health check that means something
Worth its own section because the common implementation is actively misleading.
A load balancer health check that requests the front page and accepts a 200 will pass while the database is unreachable, because Drupal can serve a cached page without it. The instance stays in rotation, serving stale content, and nothing alerts.
A useful health endpoint exercises the dependencies: it opens a database connection, touches the cache backend, and reports honestly. It should also be cheap, uncached, and excluded from access logs so it does not distort traffic metrics.
Distinguish two checks. A liveness check answers whether this instance should stay in rotation. A readiness check answers whether it should receive traffic yet, which matters during a deployment when the cache is cold.
Logs, and the part that is a design decision
Drupal writes to its own log by default, which is convenient and wrong for a platform: it stores logs in the database, so a database problem removes the record of the database problem, and each instance keeps its own view.
Logs should be shipped off the instance to somewhere they can be retained, searched and correlated with infrastructure and security events. Three things make that useful rather than merely large:
- Structure. Structured records rather than free text, so they can be queried rather than grepped.
- Correlation. A request identifier that appears in the edge log, the application log and the error, so one request can be followed across layers.
- Retention with a reason. Long enough for an investigation, and governed, because logs contain personal data.
That last point is regularly forgotten. A log store is a data store with all the obligations of one.
Where OpenTelemetry fits, and where it does not
OpenTelemetry describes itself as an observability framework and toolkit designed to facilitate the generation, export and collection of telemetry data such as traces, metrics and logs.
Its value here is portability. Instrumenting to a vendor neutral standard means the platform can change without re-instrumenting the application, which matters on an estate expected to outlive a tooling decision.
It is equally important to read its own limit, which the project states plainly: OpenTelemetry is not an observability backend itself. It generates and exports; something else stores, queries and alerts. Treating it as a monitoring platform is a common and expensive misunderstanding.
Alongside it, Prometheus describes itself as an open-source systems monitoring and alerting toolkit originally built at SoundCloud, and notes that it is designed for reliability, to be the system you go to during an outage to allow you to quickly diagnose problems. That framing is the right test for any monitoring choice: is this the thing you would open first at three in the morning, and will it be up when the platform is not?
Synthetic monitoring
Metrics tell you about traffic that arrived. Synthetic checks tell you about journeys nobody happened to exercise in the last ten minutes.
Run them from outside the platform, against the real hostname, over the real edge, and have them exercise the journeys that matter rather than the front page: a search, a form submission, a login, a page behind authentication. A site that is technically up and functionally broken should be noticed by a machine rather than by a visitor.
Certificate expiry deserves a specific mention, because it is the outage that is entirely preventable and still happens regularly. Check it as a synthetic, with enough warning to act.
Alerting without training people to ignore it
The failure mode is not too few alerts. It is too many, which produces the same outcome as none.
Three rules keep alerting useful.
- Every alert has an owner and a runbook. If nobody would act on it, it is a dashboard line rather than an alert.
- Alert on symptoms, not on causes. High CPU is a cause and often harmless. Elevated error rate is a symptom users experience. Page on the second.
- Review what fired and what was ignored. Monthly. An alert acknowledged and dismissed twenty times has trained the team, and the training will apply to the real one.
Thresholds set during a build are guesses against synthetic load. The first month of real traffic is what produces a baseline, which is why tuning is scheduled work rather than something that settles.
Across an estate
Forty sites means the question changes from "is this site healthy" to "which of these sites needs attention". Practically that means per site dashboards generated from a template rather than built by hand, alert routing that knows which team owns which site, and an estate view that ranks by deviation rather than showing forty tiles.
It also means observability is provisioned with the site. If a dashboard and its alerts are created by the same automation that creates the environment, coverage is complete by construction. If they are created afterwards by a person, coverage decays from the first site that is stood up in a hurry. That provisioning belongs with Infrastructure as Code.
The signals a migration specifically needs
During a migration the platform is asked a question it will not be asked again: does the new site behave the same as the old one? Observability is what answers it, and a few signals earn their place only in that period.
- A baseline captured before the move. Response time distribution, error rate, traffic shape by hour and by day, cache hit ratio. Without it, the first week on the new platform has nothing to be compared against, and every observation becomes an opinion.
- Error rate compared, not merely observed. A new platform will produce some errors. The question is whether it produces more of them than the old one, and only a baseline makes that answerable.
- Traffic arriving at the source after cutover. The list of integrations and clients that did not get the message. This is the single most useful signal on cutover night and it is available simply by continuing to watch the system you are leaving.
- Content and search parity. Node counts, media counts and search result counts on both sides, compared automatically rather than sampled by eye.
- Scheduled work. Whether cron and queues on the new platform are completing within the same window. A nightly job that now takes six hours instead of one is a problem discovered on the fifth night unless something is watching.
All of these belong in the automated acceptance suite rather than in a person's judgment, which is what makes the comparison the same for every site and defensible afterwards. That argument is made in the migration factory approach, and the cutover-night use of it is in cutover and rollback strategy.
What to check on an existing estate
- Would you know the site was broken before a user told you?
- Does the health check exercise the database, or only return a cached page?
- Are application logs anywhere other than the site's own database?
- When an alert fires at three in the morning, what does the responder open first?
- Which alerts fired last month, and how many were acted on?
Question one is answered honestly by looking at how the last few incidents were actually detected. If the answer is a phone call, the observability layer is decorative.
Observability is a layer of the reference architecture and the input to the operating model in enterprise Drupal managed services. It is built as part of enterprise Drupal platform modernization rather than added afterwards, and if the answer to question one is uncomfortable, that is a good place to start.
Sources
The external statements on this page are quoted from the following, each re-read on 10 September 2026.